Posted in Data Visualization, Python, Road Safety
Plotting Traffic Crash Trend using Python

Plotting Traffic Crash Trend using Python
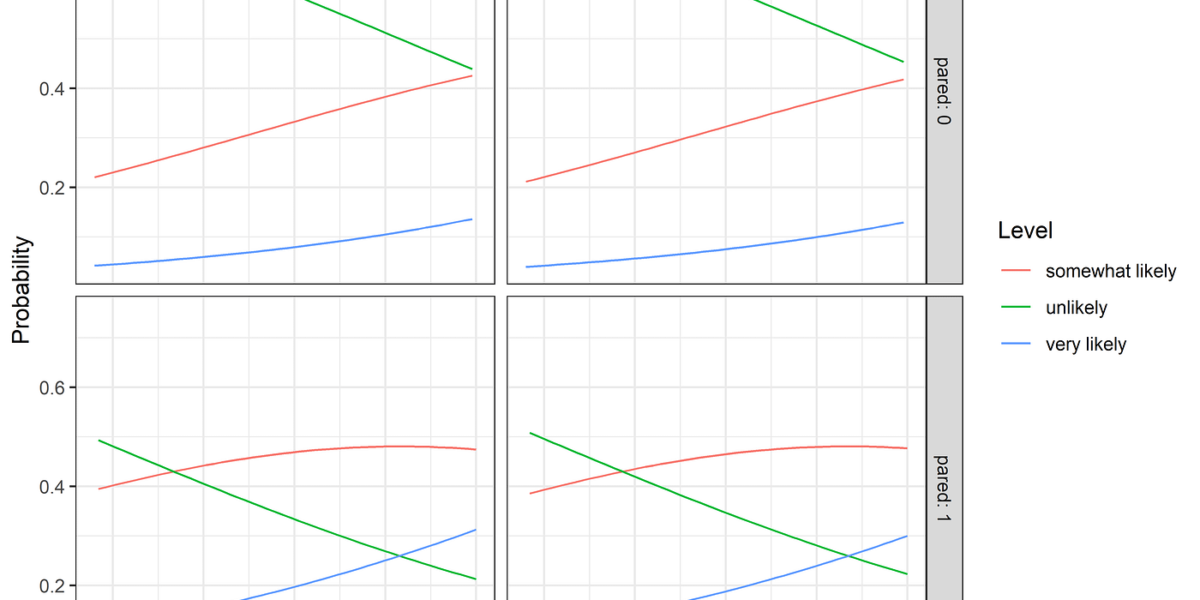
Ordered Logistic Regression in R

Learn data visualization using Python from scratch

Learn data visualization using Python from scratch

Learn data visualization using Python from scratch

Learn data visualization using Python from scratch