Skip to content
  • My Portfolio
One Zero Blog

One Zero Blog

Learn Everyday Something New 😀

  • Home
  • Blogs
    • Books
    • Data Science
    • Python
    • R
    • Data Visualization
    • Statistics
    • Machine Learning
    • Application
  • PhD Diaries
  • Road Safety
  • Medium Blogs
Survival analysis in Stata
Posted in Machine Learning, Stata

Survival Analysis in Stata (KM Estimate, Cox-PH and AFT Model)

  • Rahul Raoniar

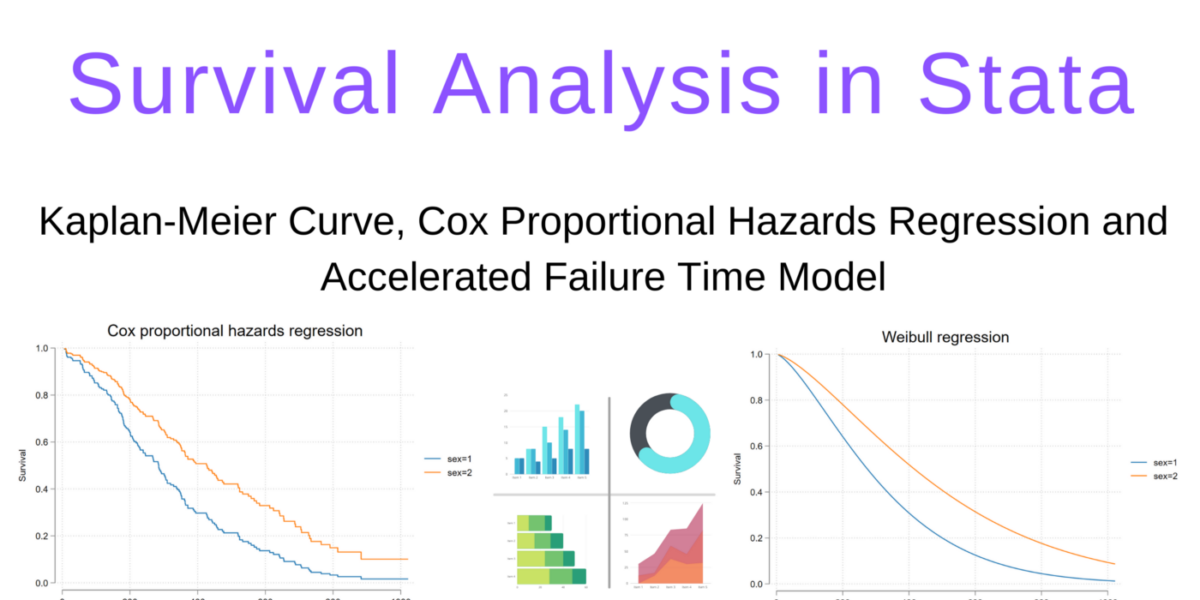
Learn Survival Analysis (Time to Event Analysis) in Stata for Research

Read More
Survival Analysis Python
Posted in Machine Learning

Survival Analysis in Python (KM Estimate, Cox-PH and AFT Model)

  • Rahul Raoniar

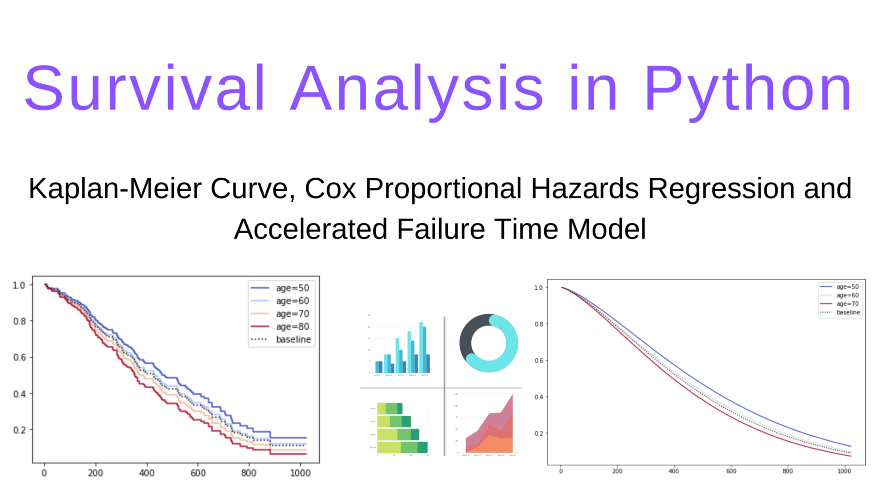
Learn Survival Analysis (Time to Event Analysis) in Python for Research

Read More
Posted in Python, Statistics

Finding the Best Distribution that Fits Your Data using Python’s Fitter Library

  • Rahul Raoniar

Learn how to identify the best-fitted distribution.

Read More
Posted in Machine Learning, R

Modelling Binary Logistic Regression using Tidymodels Library in R (Part-1)

  • Rahul Raoniar

Step by step guide to fit logistic regression using tidymodels library

Read More
Trend
Posted in Data Visualization

Generate Publication Ready Facet, Pair, and Joint Plots using Seaborn Library (Part 2)

  • Rahul Raoniar

Generate facet plots using Python’s seaborn library

Read More
Image by Tumisu from Pixabay
Posted in Data Visualization

Generate Publication-Ready Plots Using Seaborn Library (Part-1)

  • Rahul Raoniar

Generating different types of plots using Python’s Seaborn library.

Read More
  • « Previous
  • 1
  • 2
  • 3
  • 4
  • 5
  • …
  • 7
  • Next »

Author Bio

http://My%20Photo

Rahul Raoniar

Post Doctoral Fellow at IIT Bombay

I am a passionate researcher, programmer, Data Science/Machine Learning enthusiast, YouTube creator and Blogger. Predicting unknowns, discovering patterns and revealing useful insights from data excites me the most.

Recent Post

  • Crash trend plot

    Plotting Traffic Crash Trend using Python, Matplotlib, and Seaborn

    April 29, 2023April 29, 2023

  • Ordered logit model

    Ordered Logistic Regression in R (research-oriented modeling and interpretation)

    April 29, 2023April 29, 2023

  • Boxplot

    Introduction to Box and Boxen Plots — Matplotlib, Pandas and Seaborn Visualization Guide (Part 3)

    October 19, 2022October 19, 2022

  • Photo by James Orr on Unsplash

    Introduction to Dodged Bar Plot (with Numerical Stats)— Python Visualization Guide (Part 2.3)

    August 31, 2022August 31, 2022

Categories

Archives

Recent Post

  • Crash trend plot

    Plotting Traffic Crash Trend using Python, Matplotlib, and Seaborn

    April 29, 2023April 29, 2023

  • Ordered logit model

    Ordered Logistic Regression in R (research-oriented modeling and interpretation)

    April 29, 2023April 29, 2023

  • Boxplot

    Introduction to Box and Boxen Plots — Matplotlib, Pandas and Seaborn Visualization Guide (Part 3)

    October 19, 2022October 19, 2022

TAGS

Anaconda (1) Bar Plot (1) Books (2) Coursera (1) Courses (1) Data Science (4) Decision Tree (1) Deep Learning (2) Distributions (1) ECDF (1) ggplot2 (2) Hyper-parameter Tuning (2) IDE (1) IPython Notebook (2) Keras (1) Learning (1) LIME (1) Logistic Regression (3) Machine Learning (12) Manipulation (1) Matplotlib (1) Miniconda (1) MLR (2) Model Explanation (2) Note-taking (1) Notion (1) Plotting (1) PyCaret (1) PySpark (1) Python (21) PyTorch (1) R (8) Research (3) Road Safety (1) Seaborn (2) Set-up (1) SHAP (1) Stata (3) Statistics (4) Students (1) tidymodels (1) Visualization (9)
Learn Everyday Something New